How can we differentiate Big Data Analytics from Statistical Predictive Modeling Techniques?
Category: Hadoop Posted:Apr 10, 2017 By: Alvera Anto
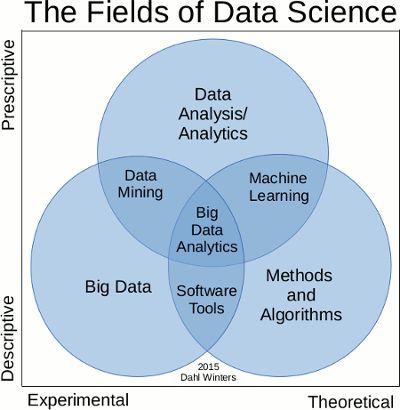
Big Data Analytics is a type of analytics executed upon Big Data. Descriptive statistics, Statistical modeling, Machine learning and even Data visualization can all be considered as Big Data Analytics as long as the analytics is performed on big data.
The definition of Big Data, given by the research and advisory company Gartner is Big data is high volume and high velocity and/or high variety information assets that demand cost-effective, innovative forms of information processing that allow enhanced insight, decision making, and process automation.
Learn HADOOP from Industry Expert
Predictive Modelling techniques can be classified into two groups – Statistical Modelling techniques or Machine Learning techniques. The prime difference between the two techniques is the assumptions of the data generation process. In the statistical modeling approach, the assumption is that data is generated from a consistent but unordered data generation process. Therefore the term ‘modeling the data’, and assuming various distributions etc. exists. In machine learning, there is no such assumption. The data generating process is a black box.
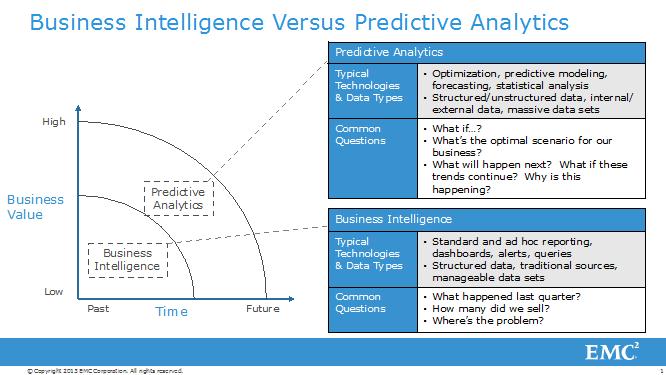
Predictive Analytics is the use of data, statistical algorithms and machine learning methods to recognize the likelihood of future outcomes based on historical data. The objective is to go beyond knowing what has happened to offer the best evaluation of what will happen in the future.
Predictive Analytics History and Current Advances
Predictive Analytics has been around for several decades, and now it has transformed into a technology whose time has come. With each passing day, various enterprises are turning to predictive analytics to boost their bottom line and enhance their competitive advantage. The reasons for the increased attention in Predictive analytics range anything from growing volumes and forms of data, to rising interest in utilizing data to generate precious insights. The presence of faster and more inexpensive computers coupled with user-friendly software also add to this cause.
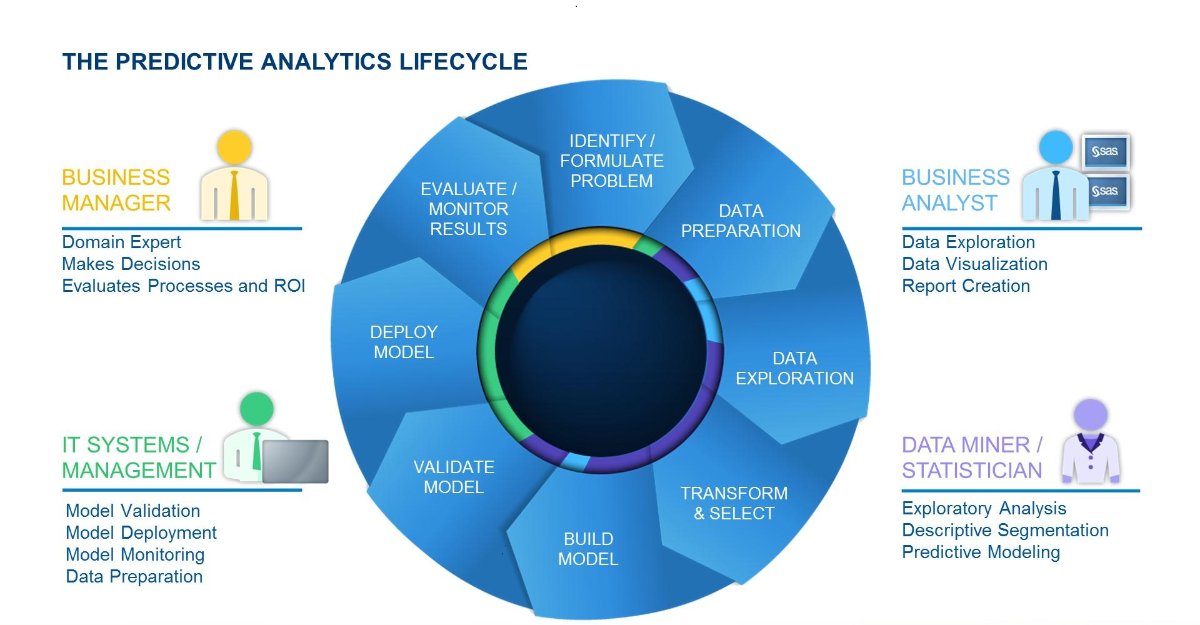
Highly interactive and customized software gaining ubiquity, predictive analytics is going beyond the domain of statisticians and mathematicians. Business Analysts and line-of-business experts are utilizing these technologies as well.
Why is Predictive Analytics Important?
Businesses are looking towards predictive analytics to maximize their bottom line and competitive advantage. Some of the most common uses include:
- Detecting Fraud – Combining multiple analytical methods can enhance pattern detection and prevent criminal behavior. Cyber security has become a cause for growing concern, and high-performance behavioral analytics inspects all activities on a network in real-time to catch anomalies that may show fraud, zero-day vulnerabilities, and advanced persistent threats.

- Optimizing Marketing Campaigns – Predictive Analytics are utilized to find customer responses or purchases, as well as provide cross-sell opportunities. Predictive models help businesses attract, retain and grow their most profitable customers.
- Enhancing Operations- Many enterprises utilize predictive models to forecast inventory and manage resources. Airlines utilize predictive analytics to fix ticket prices. Hotels attempt to forecast the number of guests for any given night to increase occupancy and maximize revenue. Predictive analytics empowers enterprises to function more efficiently.
- Minimizing risk- Credit scores are utilized to evaluate a buyer’s likelihood of default for purchases and serve as a great example for predictive analytics. A credit score is a number produced by a predictive model that uses all data regarding a person’s creditworthiness. Other risk-related uses include insurance claims and collections.
Know more about HADOOP with FAQs
Who’s Using It?
Almost any industry can utilize predictive analytics to minimize risks, optimize their operations and maximize revenue. Here are a few examples.
Banking and Financial Services
The financial industry, with massive quanta of data and money hanging in the balance, has long since adopted predictive analytics to detect and eliminate fraud, assess credit risk, maximize cross-sell and upsell opportunities and keep valuable customers coming back. The Commonwealth Bank utilizes analytics to forecast the probability of fraud activity for any given transaction before authorization (within 40 milliseconds of the transaction initiation).
Retail
There is a famed study that has shown men who purchase diapers frequently purchase beer at the same time. Retailers all around are utilizing predictive analytics to decide which products to stock. And even the effectiveness of promotional events and which offers are most appropriate for consumers are decided by such analytics. The global retailer staples analyzed consumer behavior to gain a comprehensive picture of their customers, and harnessed a 137 percent ROI!
Oil, Gas and Utilities
The energy industry has adopted predictive analytics with great gusto, whether it is predicting equipment failures and future resource requirements, minimizing safety and reliability risks, or enhancing overall performance. The Salt River Project is the second-largest public power utility in the US and one of the largest water suppliers of. Analyses of machine sensor data forecast when power-generating turbines need upkeep.
Governments and the Public Sector
Governments have been key players in the advancement of computer technologies. The US Census Bureau has been analyzing data to comprehend population trends for decades. The government now utilize predictive analytics like most industries to detect and prevent fraud, enhance service and performance; and better comprehend customer trends. They are also using predictive analytics to improve cyber security.
Health Insurance
Along with detecting claims fraud, the health insurance domain is taking measures to recognize patients at high risk of chronic disease and find what interventions are best suited to each patient. A massive pharmacy benefits company named Express Scripts utilizes analytics to recognize those not sticking to prescribed treatments, leading to savings of $1,500 to $9,000 per patient!
Manufacturing
For manufacturers, it is of paramount importance to recognize factors leading to reduced quality and production failures, as well as to optimize parts, service resources and distribution. Lenovo is one of the more famous manufacturers that have utilized predictive analytics to better comprehend warranty claims. This is an initiative that has led to a 10 to 15 percent reduction in warranty overheads.
How it Works
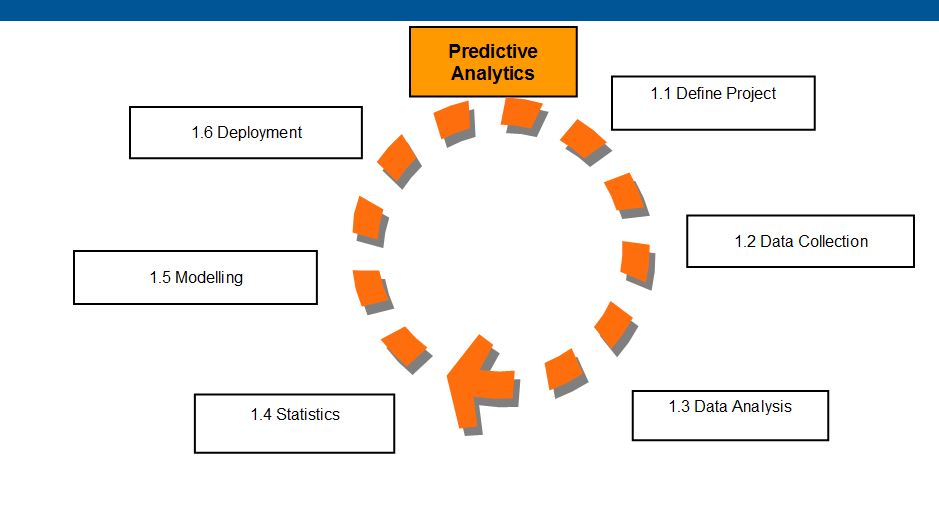
Predictive models utilize known results to develop or train a model that can be utilized to predict values for different or new data. Modeling offers results in the form of predictions that represent a likelihood of the target variable such as revenue based on estimated significance from a group of input variables.
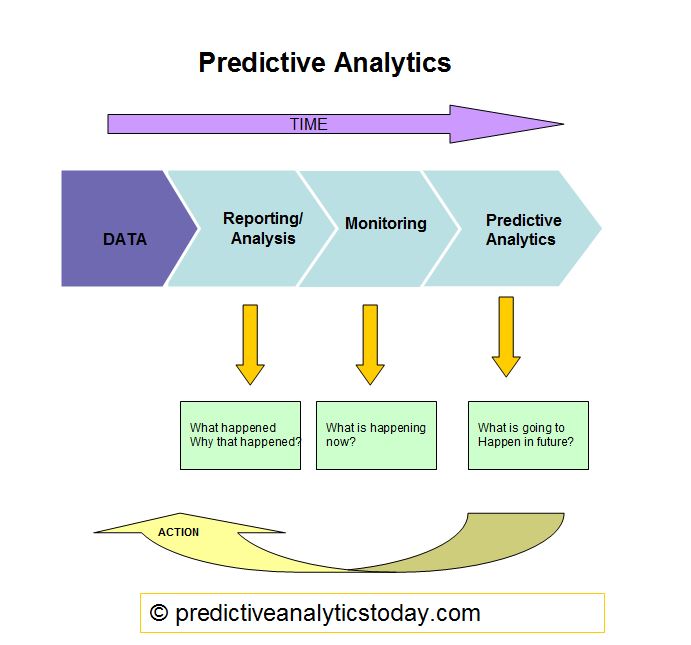
This varies from descriptive models that help one comprehend what happened or diagnostic models that help one comprehend prime relationships and find out why something happened.
There are two types of predictive models.
- Classification models predict class membership. For example, one attempts to classify whether someone is likely to leave, respond to a solicitation, or the nature of the credit risk, etc. Typically, the model results are in the form of 0 or 1, with 1 being the event you are targeting.
- Regression models predict a number, for instance, the amount of revenue a customer will produce over the next year or the number of months before an element will fail on a machine.
Three of the most widely used predictive modeling techniques are decision trees, regression and neural networks.
Big Data
Big Data is a buzzword that is used to describe immense volumes of data, both unstructured and structured, Big Data overwhelms a business on a daily basis. Big Data is something that can be utilized to analyze insights which can result in a better decision and strategic business moves.
The idea of big data has been around for quite some years; most enterprises now comprehend that if they collect all the data that streams into their businesses, they can implement analytics and get considerable value from it. But even in the 1950s, decades before anyone uttered the term “big data,” businesses were using basic analytics (essential numbers in a spreadsheet that were manually examined) to uncover insights and trends.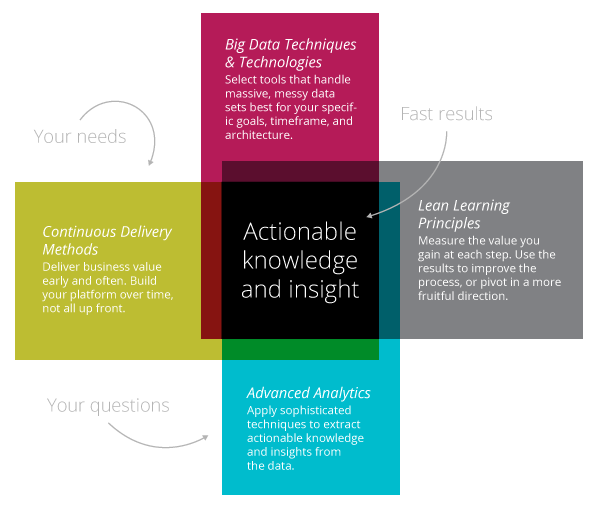
Know Everything about Big Data Hadoop before you Join the Training
The new benefits that big data analytics brings to the fore, however, are speed and efficiency. In contrast, a few years ago a business would have collected information, run analytics and discovered information that could be utilized for future decisions, today that business can recognize insights for instant decisions. The ability to work faster and stay agile gives enterprises a competitive edge not possible before.
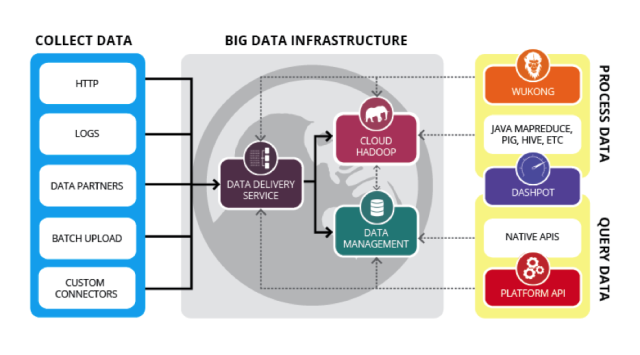
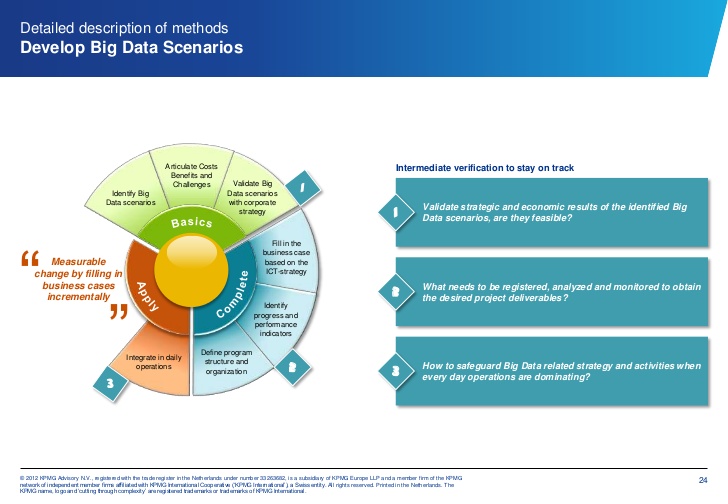
Big data can provide massive benefits to businesses of all sizes. However, as with any business project, appropriate preparation and planning are essential, especially when it comes to infrastructure. Until recently it was difficult for companies to get into big data without making heavy infrastructure investments (expensive data warehouses, software, analytics staff, etc.). But times have changed. Cloud computing, in particular, has opened up a lot of options for using big data, as it means businesses can tap into big data without having to invest in massive on-site storage and data processing facilities.
In order to get going with big data and transform it into insights and business value, it’s probably one will require investing in the following key infrastructure components:
- Data Collection – This is where the data reaches the enterprise. It encompasses everything from sales records, marketing lists, customer database, feedback, social media channels, email archives and any data obtained from monitoring or measuring aspects of your operations. One may already have the data required, but there is a high probability of a need to source some or all of the data required.
If there is no need to source new data, this may need new infrastructure investments. Infrastructure requirements for capturing data depend on the form or types of data needed, but prime options might include: sensors; applications which generate user data; CCTV video; beacons; changes to websites that prompt customers for more information; and social media profiles.
- Data Storage – This is where data is kept post gathering from sources. Since the volume of data generated and stored by companies has exploded, advanced but accessible systems and tools have been developed to aid this task. The prime storage choices include a conventional data warehouse; a data lake; a distributed or cloud-based storage system; and the company server or a plain computer hard disk.
- Data Analysis – To utilize the data stored to reveal something useful, one will require processing and analysis. So this layer is all about extracting insights from data. This is where programming languages and platforms are brought into the picture.
There are three fundamental steps in this process:
- Preparing the data (recognizing, cleaning and formatting the data to prep for analysis);
- Constructing the analytic model;
- Obtaining a conclusion from the insights received.
Data Visualization/Output
This is how the insights extracted from data analysis are passed on to the people who require them, which refers to the decision makers in your company. Clear and precise communication is vital, and this output is in the form of brief reports, figures, charts, and prime recommendations. It has to be remembered that if the primary insights aren’t clearly presented, they won’t lead to action.
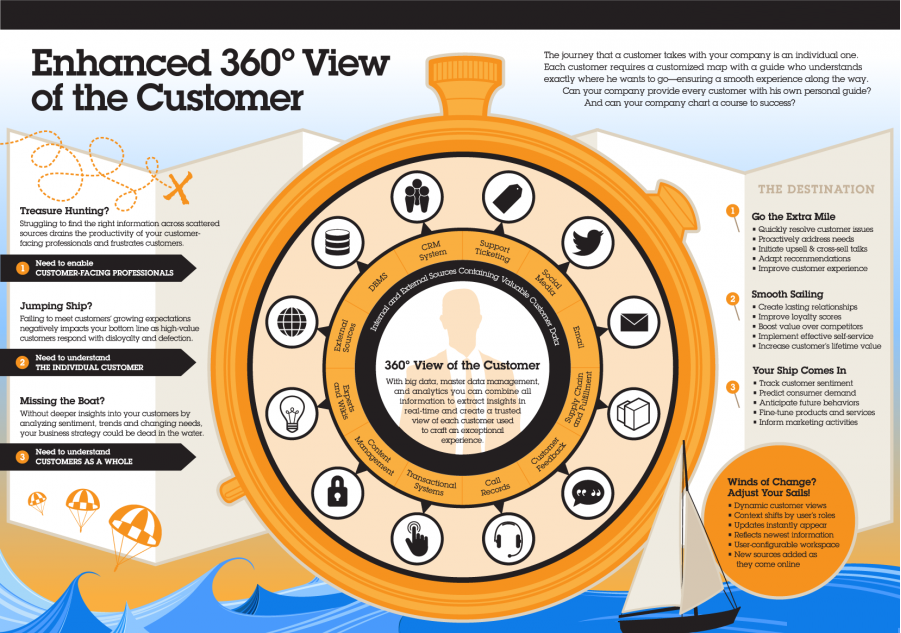
Key data output options comprise of commercial data visualization platforms that make the data appealing and easy to comprehend, management dashboards and basic graphics such as charts and graphs that communicate insights. In my experience, for smaller businesses looking to enhance their decision making, simple graphics or visualization tools like word clouds are more than sufficient to present data insights.
Register for HADOOP Free Live Webinar
Conclusion
While Big Data Analysis deals with the bulk of customer data received in industries, predictive analytics depends on the predictive power of leveraging customer trends in the long or short run. With all the differences between both approaches, both approaches to data utilization are equally important to enterprises of every scale.

 99999999 (Toll Free)
  +91 9999999